Google Analytics for Single-Page CSR Reports

When it comes to Google Analytics, how much can you learn from a single-page website? Actually, a lot.
There are several good reasons our clients choose to house Sustainability content on a single page. It may be related to budget. Often, it’s because they want to stage all of the information within a single silo on their main corporate website.
All of this is valid and once the decision has been made, part of our job is to help our clients gather as much information as they can about their users. Structured properly, there is much to learn about audiences based on how they navigate a single page. But you’ve got to approach it properly – from day one. With that in mind, here are my four best practices for single-page websites when it comes to Google Analytics.
A quick note: The debate about whether multi-page or single-page websites are appropriate (both from an SEO and a UX perspective) is well worn and has been covered by other very intelligent people, so I won’t be discussing that here.
Learn about your audience by using Event Tracking
When it comes to Google Analytics, it’s important to understand that we can only track actions. (We can gather data around demographics, but more on this later.) So if all of the information on your single page is immediately viewable, users don’t need to take any further steps to engage with the content that interests them and the only measurement of “engagement” we gather is time spent on the page.
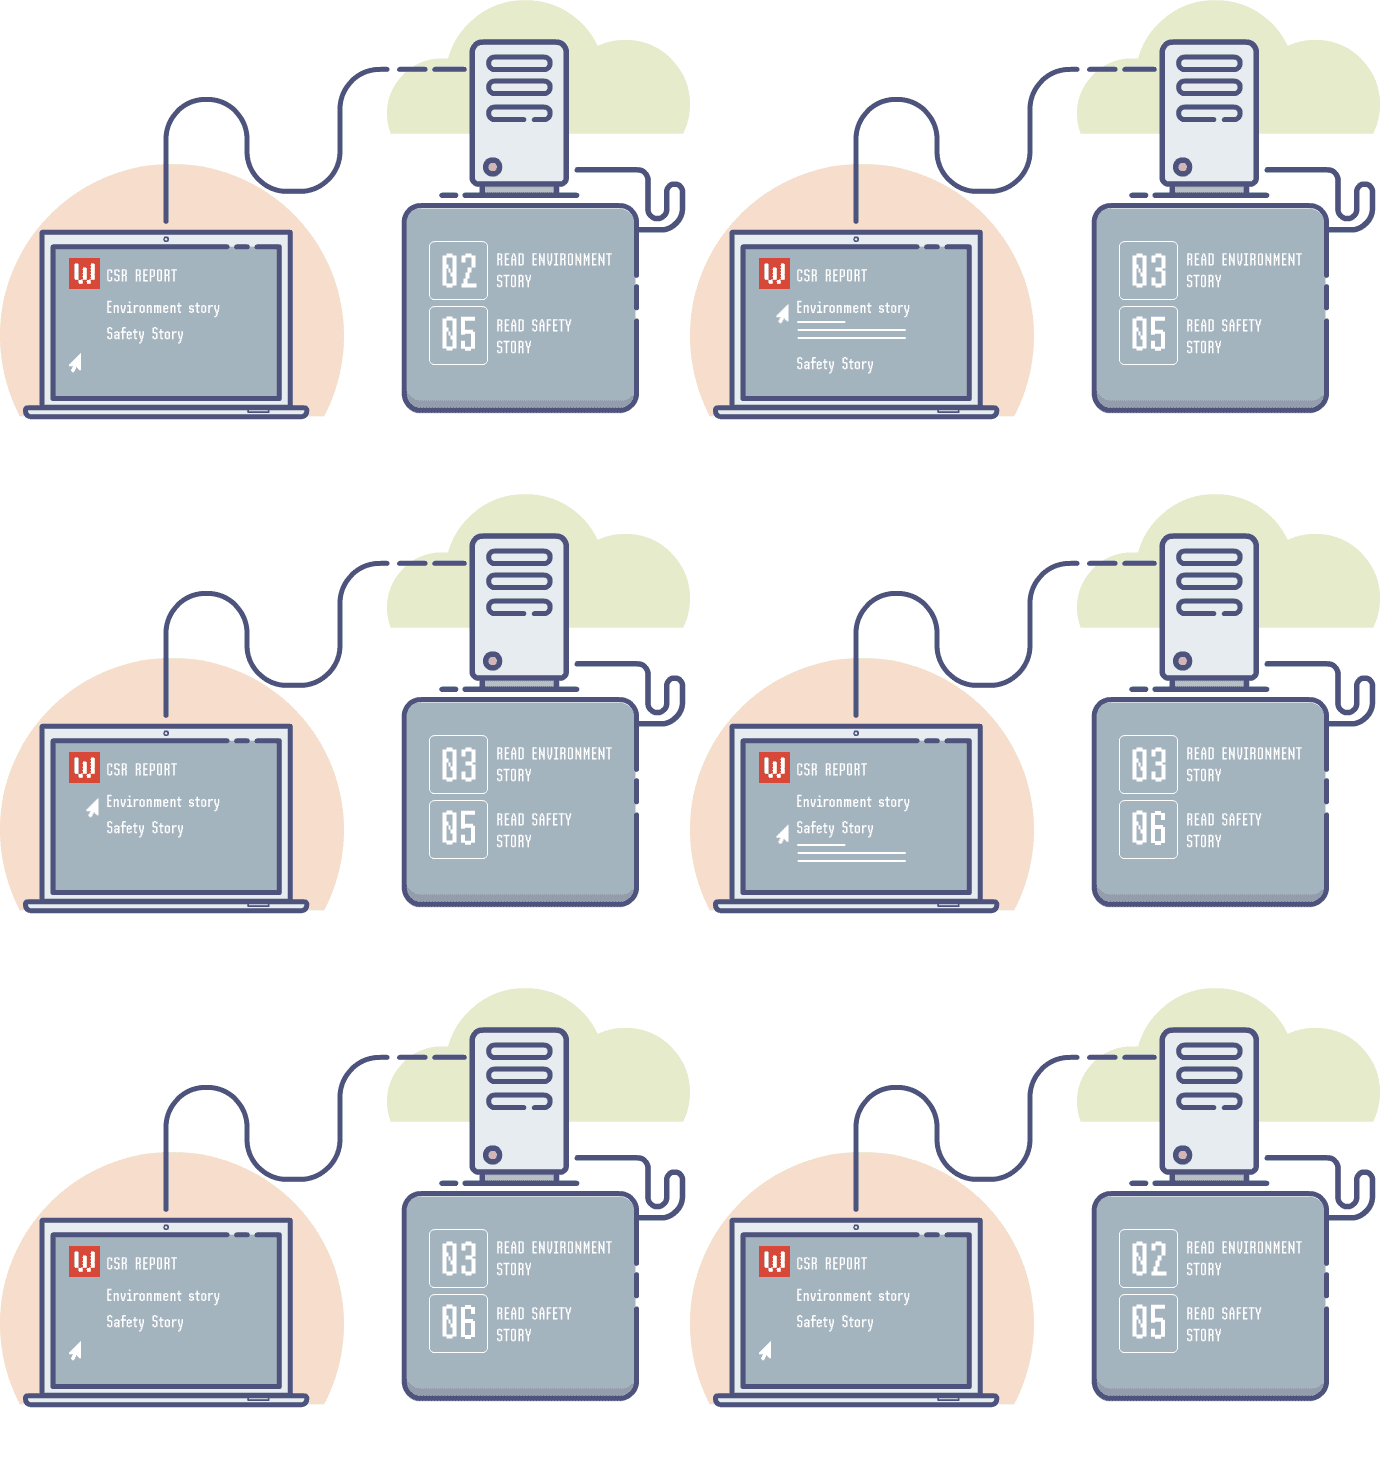
While it may seem counterintuitive to introduce barriers to information (why would we hide what users want to see?), adding fold-downs or “read more” functions give us good data to latch on to – especially when we design the site so that stories align clearly with particular issues, locations or initiatives.
We must manually introduce code to ensure Google Analytics is leveraging Event Tracking to measure what is important to us. Common practical examples of events we track for clients include:
- Engaging with a story (we label events: for instance, “clicked Reclamation story”)
- Playing a video (we track how many users started and finished a video)
- Utilizing specific filter buttons (for instance, “filtered to see Environment stories”)
- Interacting with kinetic infographics or diagrams (which helps us understand the value of a client’s investment)
- Downloading PDF reports (helpful for getting an overall sense of conversion)
Each time a user takes one of these actions, it is logged and becomes attributable. It paints a picture of which content is interesting and useful or what headlines were attention-grabbing – without relying on traffic reports to a network of pages.

Set up properly, Event Tracking can help you understand what content on your website users interact with most – and have the most interest in.
Create Goals in Analytics for powerful reporting
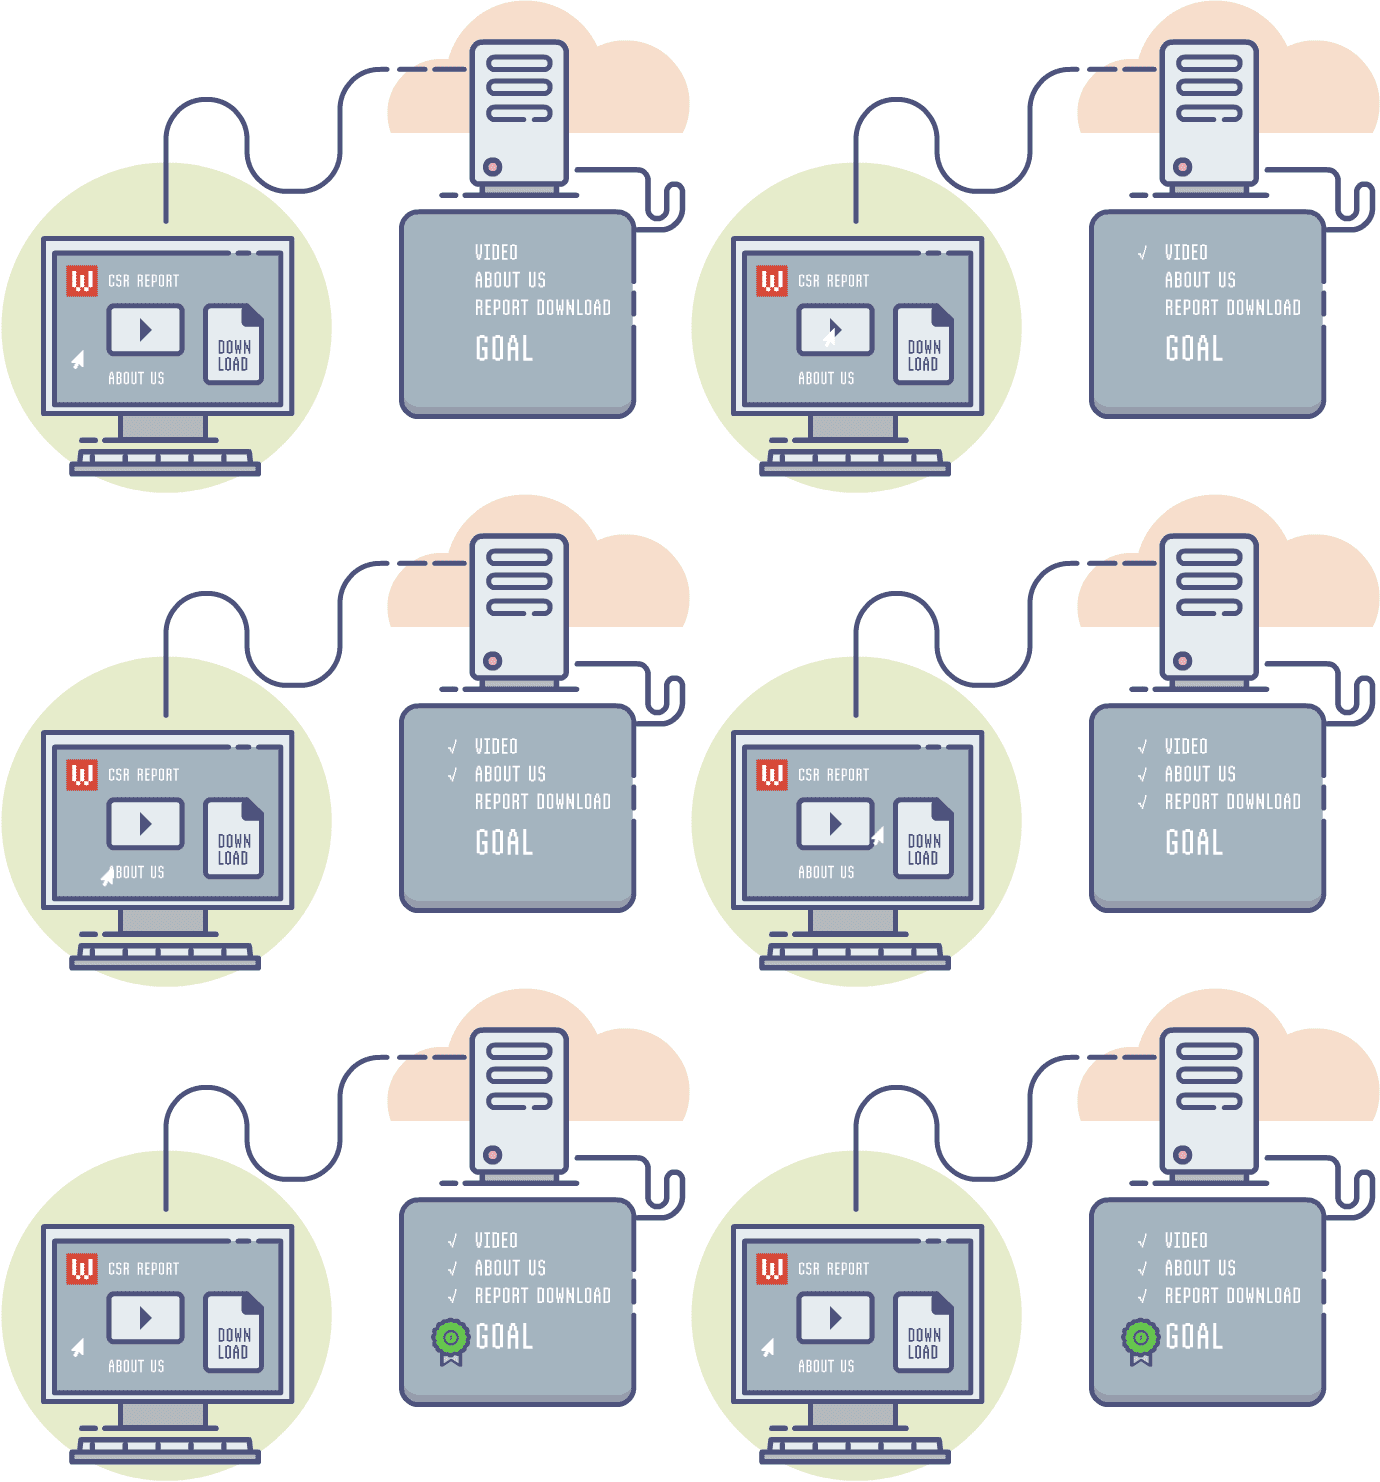
Even when a website is one page, we should still approach it strategically. The Goals function in Google Analytics is frequently underused, and benefits both clients and designers. With Goals, you can batch events into what the ideal user visit would look like. This could include non-event related information, like visit duration. I believe that thinking through Goals early in the design process helps clients (and designers) to be strategic about all aspects of the project, from content creation all the way through to digital marketing initiatives.
Think of Goals as an imaginary checklist of all the things you’d love a user to do when they visit your CSR microsite. That list might be:
- Play that video it took you four weeks to get approved;
- Click “read more” on one of your case studies; and finally
- Download the PDF report.
If knowing that someone did these would make you happy, let’s track that – specifically! That set of behaviours can be set up as a Goal – and every time any user completes that list, you win a prize. That is, you win if you agree that a Goal completion recorded in Google Analytics counts as a prize. (I sure do.)
The reason I love Goals is that it allows agencies and clients to agree on what an “engaged user” looks like, or what “success” is when it comes to a website. These can feel like subjective things, but Goals help us to isolate and quantify users who had a meaningful connection with what we created. That’s a great thing.

Linking Events together to create Goals is a great way to quantify how much of your website traffic is truly engaged. That information can be segmented to help you get more out of your marketing initiatives, or identify audiences you hadn’t previously considered.
Enable demographics: The case for more information
What does Google know about you and your users? Google knows a lot. But you won’t have access to this information unless you manually enable demographics tracking within Google Analytics before your website is launched. There are requirements associated with this step that you will have to meet: you have to disclose that you are gathering demographics data (which is anonymous, by the way).
This is frequently a touchy area within the Sustainability space, and I understand this response. We, as a group, naturally tend toward preserving privacy, and this is valid and noble. But here are some things to consider and explore:
- Is demographic data already being gathered on your main corporate website?
- How are competitors in your sector behaving? What data are they gathering and leveraging? You will be able to tell based on the disclaimers on their websites.
- Will knowing more about who successfully accesses and engages with your report (and its specific contents) improve your Sustainability report (and potentially, your Sustainability practice)?
Watch your filters
If your digital agency or web developer is setting up Google Analytics on your behalf, be sure to ask them about any filters they apply to your data. It’s best practice to eliminate some sources of traffic from your reports: traffic originating from the IP address of your developer, spam traffic (it exists!) and, for a standard corporate website, eliminating internal traffic can be a good idea. Employees so frequently access their own corporate websites that it can artificially inflate or skew valuable information. On the other hand, with Sustainability reports, employees are frequently a key audience, and you can’t go back in time and reintroduce filtered traffic. That data is potentially gone (or at best, difficult to reintegrate with reported information.)
If your employees are a key audience for your Sustainability report, I recommend having your corporate IP addresses set up as a segment. This will keep internal traffic as an easily isolated portion of your data. This applies not just to single-page CSR reports, but any stakeholder communications website.
Further reading
Why You Should Segment Absolutely Everything
Does Google Have Your Gender Right?
4 Google Analytics Goal Types That Are Critical To Your Business
Burning analytics questions? Let me know what you’d love us to cover next in the comments below, or drop me a line.


